| Post Reply | RetroFed Forum Forum Index » Extra Ordinary Comics |
| Author | Message | ||
|---|---|---|---|
 m_f
discuss.online
m_f@discuss.online Joined: 2024-12-11 |
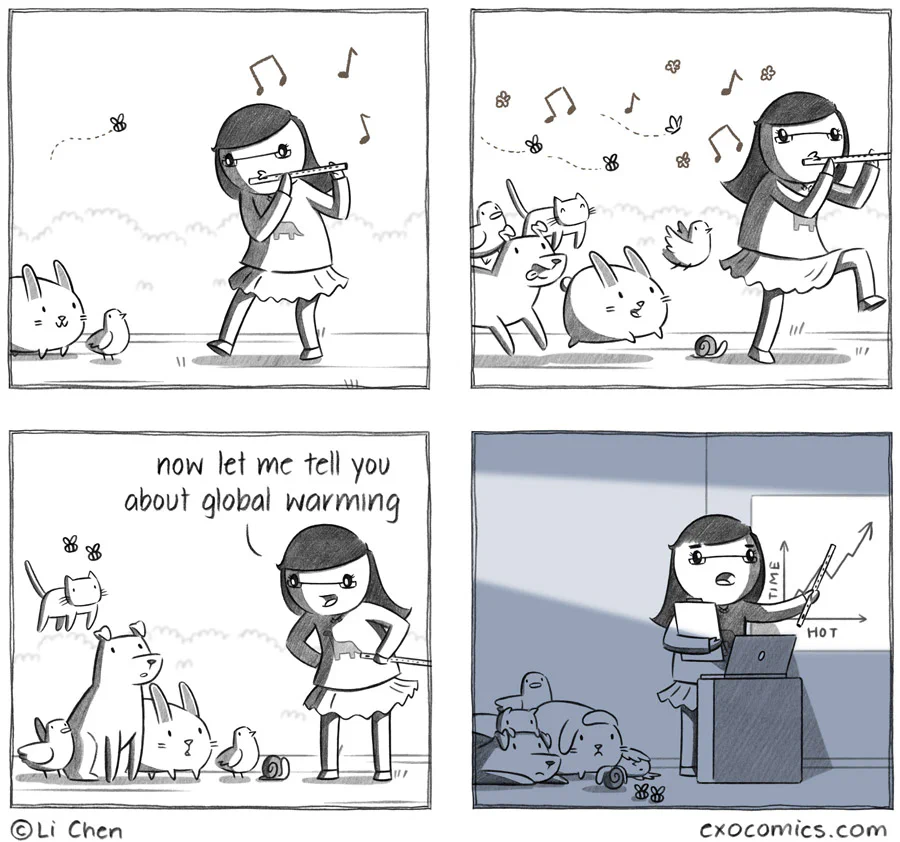
Title textany questions? Author comment:
|
||
| 200 Original | |||
|
IPlead386
sh.itjust.works
IPlead386@sh.itjust.works Joined: 2024-01-29 |
The axes on that graph bother me so much... |
||
| 40 | |||
|
Panties
lemmy.ca
Panties@lemmy.ca Joined: 2023-06-29 |
The axes on that graph bother me so much...
I was about to comment the same thing. |
||
| 5 | |||
|
harmbugler
piefed.social
harmbugler@piefed.social Joined: 2025-08-25 |
I was about to comment the same thing.
I'm irrationally upset |
||
| 6 | |||
|
CuriousRefugee
discuss.tchncs.de
CuriousRefugee@discuss.tchncs.de Joined: 2025-04-03 |
The axes on that graph bother me so much...
Seems to make sense to me. As hot increases, you see a corresponding increase in time. This has clearly been happening, and most of change climate and warm globaling research proves it. |
||
| 13 | |||
|
DarkCloud
lemmy.world
DarkCloud@lemmy.world Joined: 2024-05-19 |
Animals have the least responsibility for climate change, but will bear the brunt of the costs. |
||
| 7 | |||
|
IPlead386
sh.itjust.works
IPlead386@sh.itjust.works Joined: 2024-01-29 |
Seems to make sense to me. As hot increases, you see a corresponding increase in time. This has clearly been happening, and most of change climate and warm globaling research proves it.
Technically, it doesn't matter which of the values goes on the x-axis, and which goes on the y-axis. All analysis can flip the variables, and the result remains the same. But the message here should be "as time increases, you see an increase in hot". Time should be on the x axis, hot should be on the y axis. |
||
| 5 | |||
 agamemnonymous
sh.itjust.works
agamemnonymous@sh.itjust.works Joined: 2023-06-15 |
Technically, it doesn't matter which of the values goes on the x-axis, and which goes on the y-axis. All analysis can flip the variables, and the result remains the same. But the message here should be "as time increases, you see an increase in hot". Time should be on the x axis, hot should be on the y axis.
This graph specifically doesn't work, see the dips? That implies going backwards in time, and then forwards again |
||
| 12 | |||
|
PyroNeurosis
lemmy.blahaj.zone
PyroNeurosis@lemmy.blahaj.zone Joined: 2023-11-09 |
The axes on that graph bother me so much...
As they should. At one point tme moves backwards and hot keeps going. |
||
| 10 | |||
 MinnesotaGoddam
lemmy.world
HeyThisIsntTheYMCA@lemmy.world Joined: 2023-06-27 |
The axes on that graph bother me so much...
No it's accurate. The hotter you are, the more time you get |
||
| 10 | |||
|
Feathercrown
lemmy.world
Feathercrown@lemmy.world Joined: 2023-07-06 |
The axes on that graph bother me so much...
Knew this would be the top comment |
||
| 4 | |||
|
IPlead386
sh.itjust.works
IPlead386@sh.itjust.works Joined: 2024-01-29 |
This graph specifically doesn't work, see the dips? That implies going backwards in time, and then forwards again
I thought it would be implied that if you change the axes, then you also change the values accordingly. Typically, the thing you are trying to study goes on the y-axis, and the thing you are using as reference goes on the x-axis. So, if the question was "how does time behave as we change the heat", then the comic graph is the typical arrangement. Again, the graph drawn is technically not wrong. And by flipping the axes, I meant also redrawing the graph to account for the flip. But it bothers me because its against the normal convention of drawing graphs for analysis. |
||
| 2 | |||
|
wolframhydroxide
sh.itjust.works
wolframhydroxide@sh.itjust.works Joined: 2024-07-25 |
I thought it would be implied that if you change the axes, then you also change the values accordingly. Typically, the thing you are trying to study goes on the y-axis, and the thing you are using as reference goes on the x-axis. So, if the question was "how does time behave as we change the heat", then the comic graph is the typical arrangement. But the question is (or should be) "how does hea...
No, they're saying that Li switched the axes, but DIDN'T flip the data, making it nonsensical. |
||
| 2 | |||
|
agamemnonymous
sh.itjust.works
agamemnonymous@sh.itjust.works Joined: 2023-06-15 |
I thought it would be implied that if you change the axes, then you also change the values accordingly. Typically, the thing you are trying to study goes on the y-axis, and the thing you are using as reference goes on the x-axis. So, if the question was "how does time behave as we change the heat", then the comic graph is the typical arrangement. But the question is (or should be) "how does hea...
Best practice is to put the independent variable on the x-axis and the dependent variable on the y-axis. That way you can read the graph left to right instead of bottom to top. But yes this graph is wrong as drawn, unless it's implying backwards time travel. Here's the graph with the axes (and data) flipped to match the time-on-x-axis convention. See the horizontal zig-zagging? Time doesn't behave that way.
|
||
| 2 | |||
|
hoch
lemmy.world
hoch@lemmy.world Joined: 2023-08-02 |
I'm irrationally upset
I'm rationally upset |
||
| 1 | |||

| Post Reply |
Back to top |