| Post Reply | RetroFed Forum Forum Index » The memes of the climate |
| Author | Message | ||
|---|---|---|---|
 Grail (capitalised)
aussie.zone
Grail@aussie.zone Joined: 2023-12-27 |
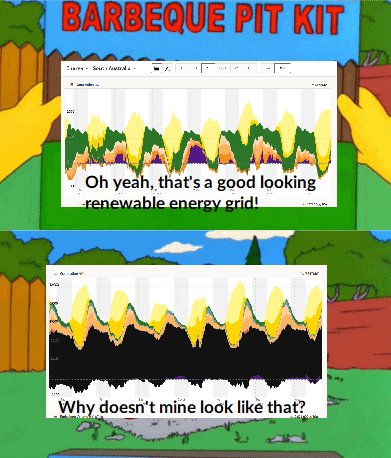
The top graph is South Australia’s energy grid. The bottom is Queensland’s. Yellow is solar, green is wind, orange is gas, purple is imports, and black is coal. Over the last week, Queensland used 27.3% renewable power, and South Australia used 81.4%. Source: https://explore.openelectricity.org.au/energy/au/ |
||
| 3 Original | |||
| Post Reply |
Back to top |